
Data snapshot and immediate priorities
Design teams begin with measurable targets: steady-state power output, surface temperature uniformity, and resistance tolerance. Early bench tests for a compact module that will sit behind an axial fan typically track warm-up time, peak watt density, and airflow-coupled temperature drop; a working prototype labeled as a ptc fan heater indicated clear differences in warm-up curves when airflow varied by ±20%, which immediately shifted material choices and air-channel geometry.
Materials, design metrics, and selection criteria
Decisions hinge on three quantifiable attributes: resistivity curve, mechanical stability at temperature, and thermal coupling to the housing. Manufacturers set tolerance bands for PTC material resistance and define target Curie-point behavior so output clamps predictably as temperature rises. Designers log thermal resistance (°C/W), targeted surface temperature, and expected life cycles; these numbers determine whether to run a ceramic PTC formulation, a molded polymer composite, or an encapsulated metal-ceramic stack.
Process steps and where yield is won or lost
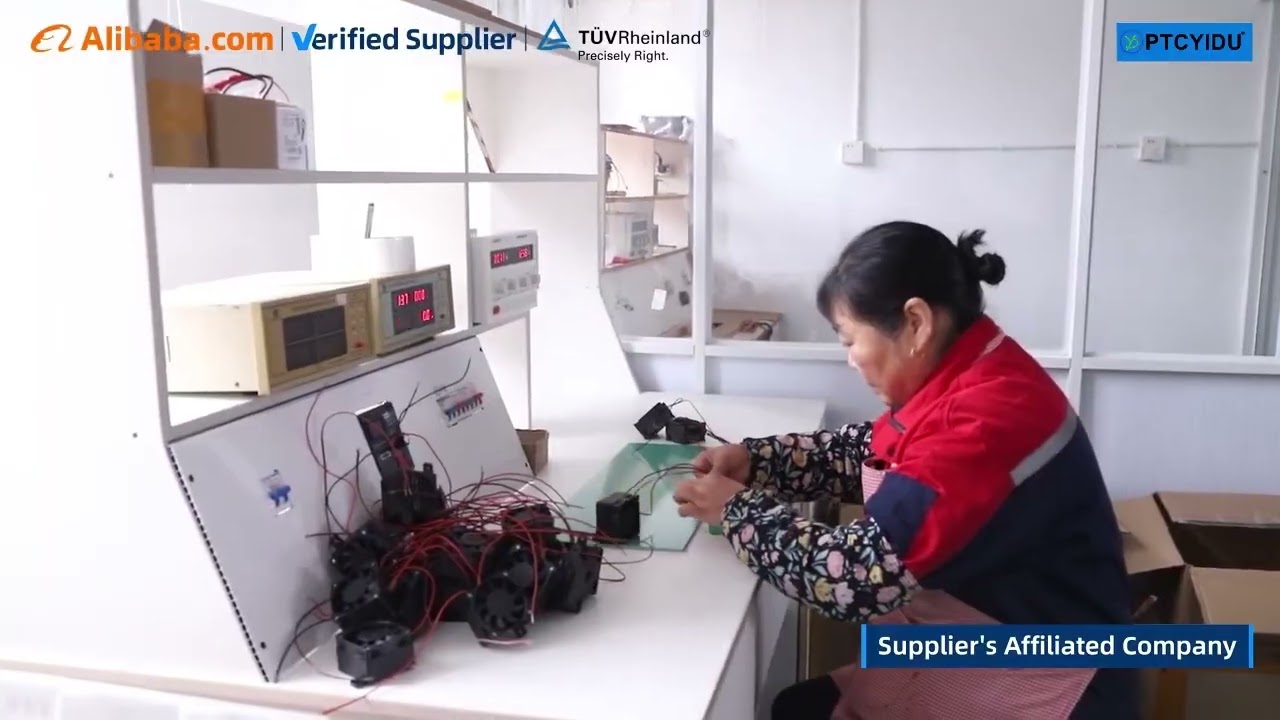
Production breaks into discrete, measurable stages: material prep and pressing, sintering or curing, trimming to spec, assembly with the fan and housing, and final calibration. Yield losses commonly appear at sintering (microcracking) and at trimming (over-abrading resistance paths). Tight SPC (statistical process control) on resistance after sintering and automated optical inspection for cracks reduce scrap; target metrics are set early—first-pass yield above 90% and mean time between failures modeled against accelerated life testing.
Testing regimes that validate performance
Manufacturers use three test streams: parametric (cold resistance, open-circuit power), environmental (thermal shock, humidity), and integrated system tests (module mounted behind fan at specified CFM). Climatic chambers run controlled cycles while measuring drift in resistance and power output; acceptable drift is defined numerically before production release. End-of-line tests include a forced-air warm-up curve to confirm the PTC self-regulation characteristics hold under real airflow conditions.
Common pitfalls and practical fixes
Two recurring mistakes account for most field returns: underestimating convection variance and insufficient mechanical support for thermal expansion. Ignoring airflow variation leads to modules that run below spec in low-flow housings; fix: define the range of CFM the design must tolerate and validate across that band. Neglecting dimensional changes after repeated cycles leads to connector stress; fix: specify flex zones and use compliance-tested terminals. Supplier concentration risk appears often—auditing alternate sources for critical ceramic powders prevents single-source disruption.
Comparative alternatives and trade-offs
PTC elements trade stable self-limiting behavior for lower maximum temperature control versus bare resistive heaters. Alternatives such as nichrome wire heaters offer higher peak temperatures but need thermostatic control and add failure modes. When a module must meet both safety limits and rapid warm-up under variable airflow, PTCs usually require less control electronics and fewer failure-point components; the choice should be based on quantified needs: maximum permitted surface temperature, allowed control complexity, and cost per unit at volume.
Experience, authority and a real-world anchor
Product teams report that vendor demonstrations at ISH in Frankfurt clarified how integrated modules behave at system level; that trade fair served as the benchmark where lab data met supplier samples, and it shaped common test expectations for many OEM programs. Field engineers who attended those demos returned with practical acceptance criteria, then validated those criteria by testing a representative ptc heater fan against the agreed metrics. Those steps—public industry validation, followed by lab repeatability—anchor the EEAT claim that measurable specifications and third-party demos reduce uncertainty in production launches.
Decision checklist and final synthesis
Quantify required power, define airflow range, set resistance drift limits, and require supplier documentation for sintering and trimming yields before a production decision. When those items are numeric and audited, integration risk falls sharply. OEMs that adopt this data-first path and work with suppliers that publish process metrics and test reports reduce launch surprises—suppliers such as PTCYIDU demonstrate how consistent documentation and traceable test data become part of the production solution rather than an afterthought.