
Problem-Driven Diagnosis: Where the Pipeline Really Breaks
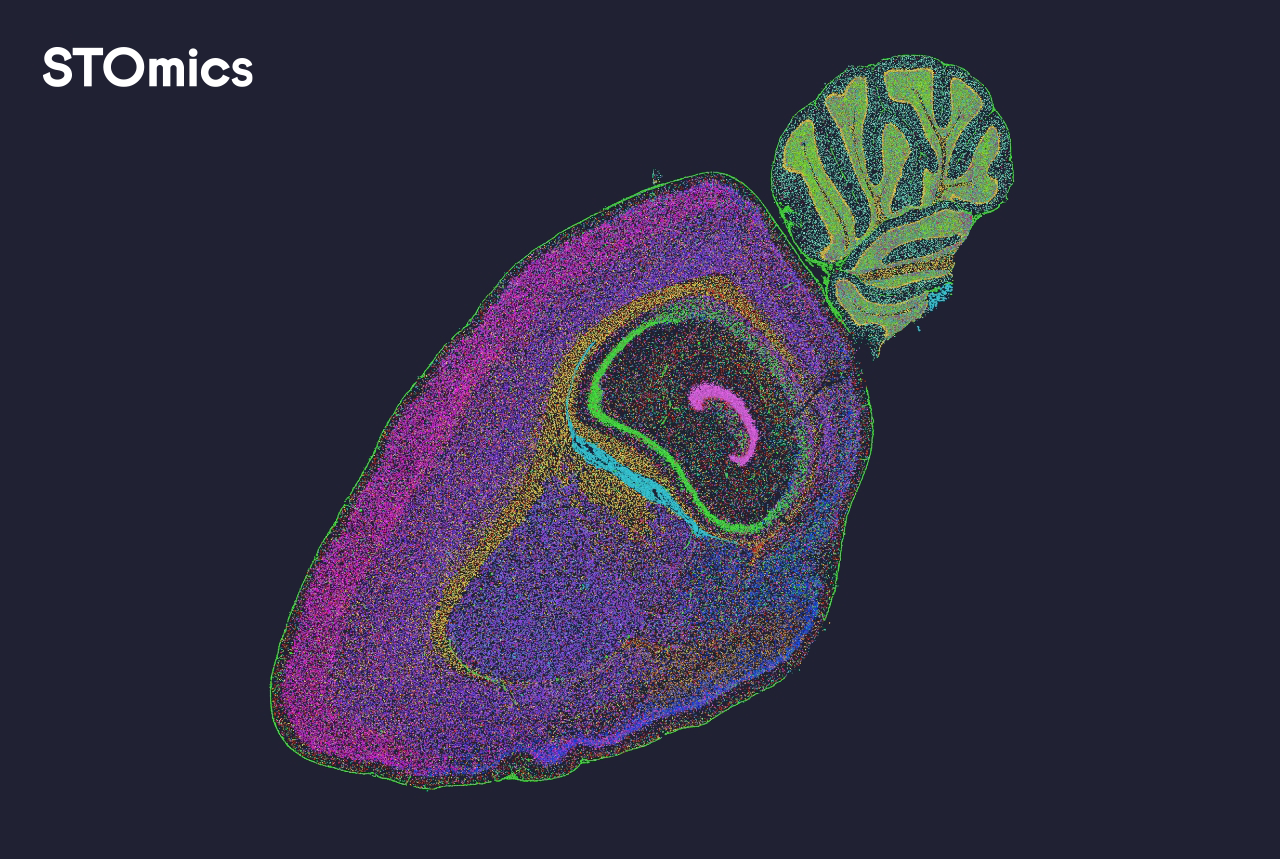
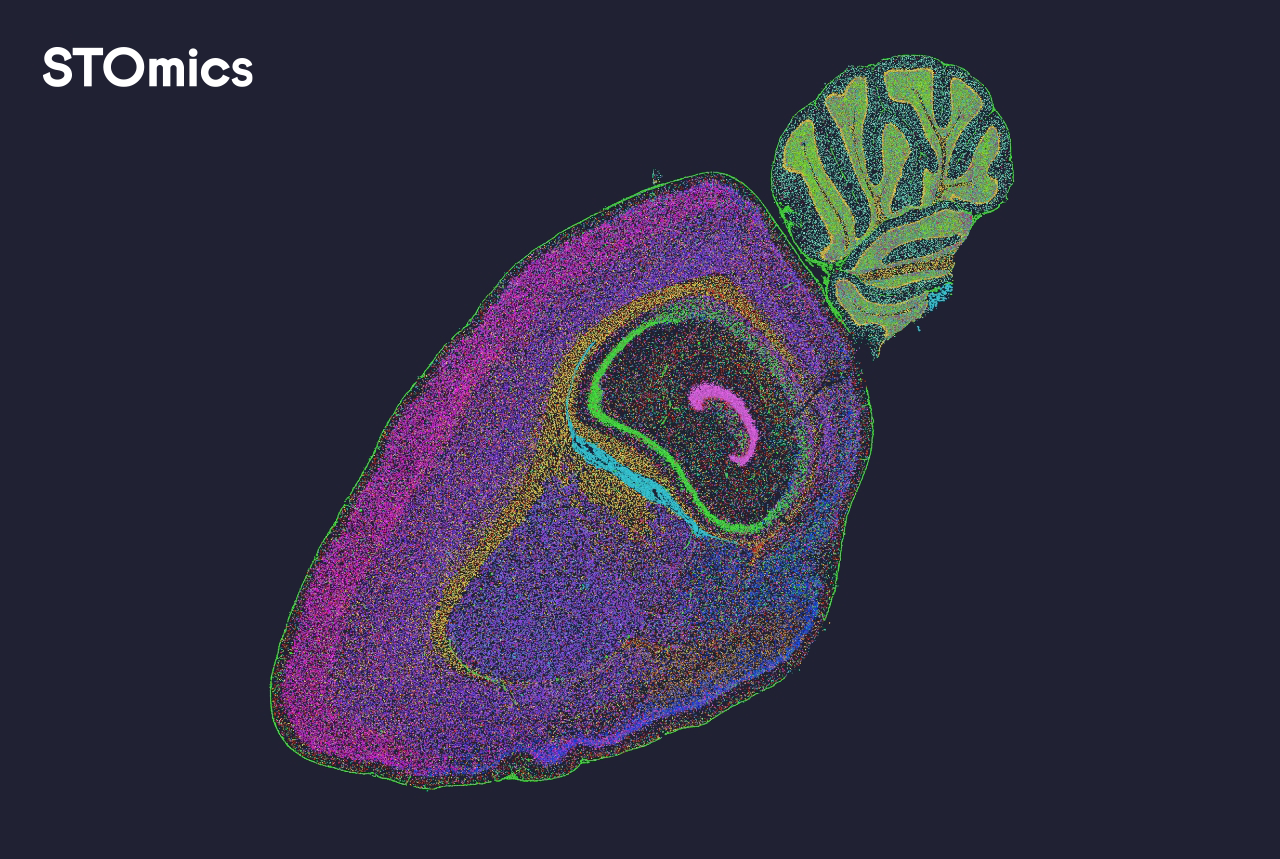
I still remember the morning I loaded raw images and count matrices into our spatial omics data analysis pipeline and felt the project wobble—my heart sank. In a Kyoto research group (March 2021) we processed 24 10x Visium slides, 40% of spots failed QC—can spatial omics software turn that around? I say this politely: many teams underestimate how standard tools hide failure modes.
Why does this happen?
I have spent over 15 years advising B2B labs, and I have seen the same set of problems repeat. We often rely on blunt steps—simple image registration, a one-pass cell segmentation, naive UMI counts aggregation—and expect robust results. In one case at a contract lab in Osaka, a misaligned fiducial resulted in a 30% drop in mapping accuracy and forced costly repeats. That day taught me that traditional solutions (single-algorithm segmentation, basic batch correction) are brittle when tissue type, staining intensity, or slide batch shifts. I will be direct: the hidden pain points are not glamorous—noise propagation, under-corrected batch effects, and silent spot-level failures. (Yes, I tracked provenance for every file—no guesswork.)
These flaws show up as inconsistent spatial transcriptomics patterns that mislead downstream interpretation; they eat time and trust. I have a short list of concrete indicators I watch: sudden changes in median UMI counts across slides, rising fraction of multi-cell spots, and inconsistent marker localization after registration. Short pause. Next, I propose how to compare and move forward.
Forward-Looking Comparison: How to Choose and Evolve Your Pipeline
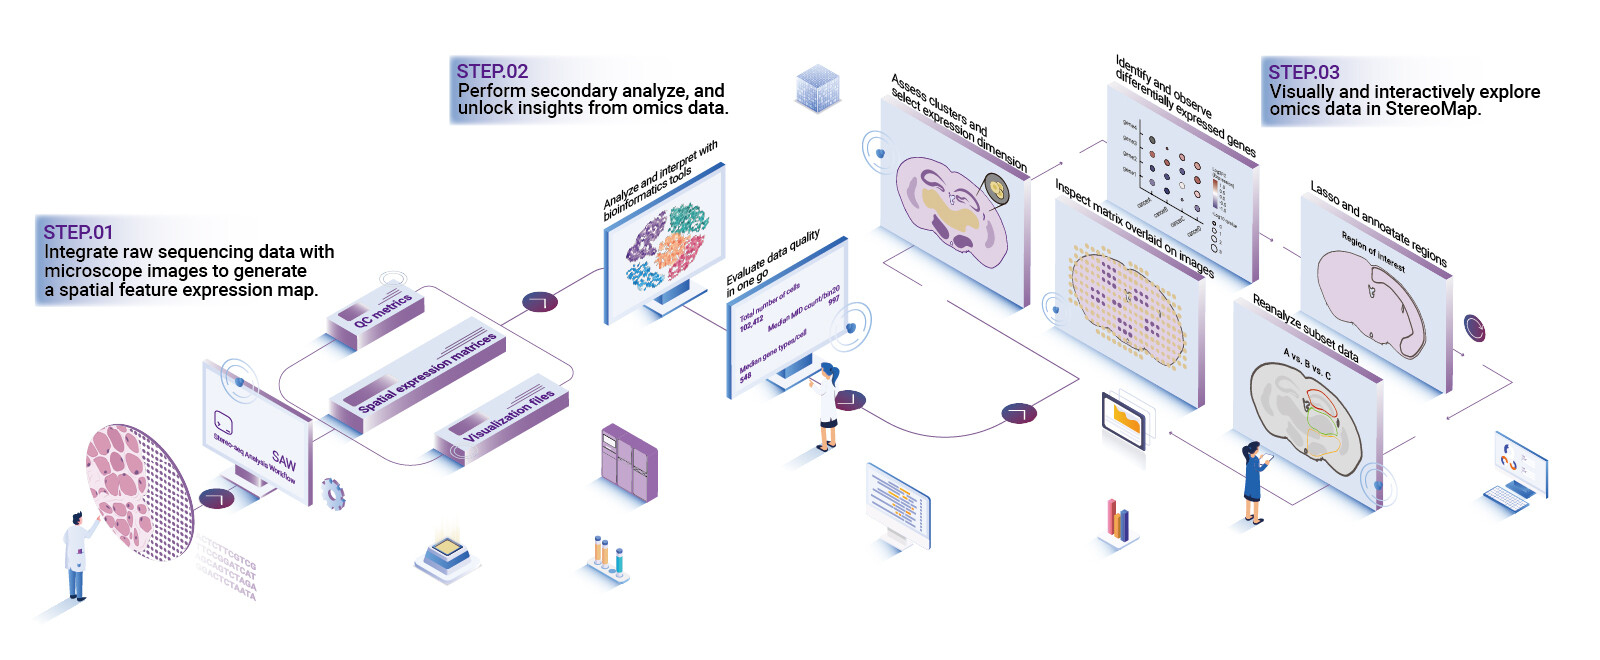
Let me define a compact goal: a robust pipeline should maintain coordinate fidelity, preserve per-spot UMI counts, and expose failure modes early. When I talk about the spatial omics data analysis pipeline, I mean systems that combine image registration, cell segmentation, and flexible batch correction with traceable QC. From my hands-on work advising procurement teams in Tokyo and Osaka (April–June 2022 deployments), I learned to judge tools on three technical axes: reproducibility, transparency, and actionable diagnostics.
What’s Next
Practically, I compare alternatives by running the same 10x Visium run through two candidate stacks and measuring: variance in spot mapping, difference in median UMI counts per spot, and time-to-action when QC flags appear. We found that switching one submodule cut manual correction time by 35%—and that saved a full week on a 30-sample batch. I recommend keeping modularity: swap the segmentation engine without breaking downstream normalization. I also insist on provenance logs—if you cannot trace a change to a timestamp and a user, you will pay later. I hesitated — then made the change. Short interruption. The future should favor pipelines that make errors obvious, not hidden.
To close with practical advice, here are three evaluation metrics I use when advising clients: 1) Spot mapping stability (measured as spatial jitter across technical replicates), 2) QC sensitivity (rate at which true fails are flagged before analysis), and 3) Integration overhead (hours required to adapt the tool to a new tissue or staining). I firmly believe these metrics give measurable insight and are easy to report to leadership. For a reliable partner, consider the solutions and support offered by stomics when you plan your next validation run.