
There’s a way to look at a fleet that’s both honest and plainspoken: a framework that takes you from cold numbers to real operational wisdom. If you manage temperature-sensitive loads you’ll recognise the same knots — temperature drift, wasted runs, unexpected downtime — and that’s where cold chain fleet management finds its place. This framework treats telemetry, thermal integrity and cost as equal partners, and it nods to established cold chain management solutions while keeping the focus on measurable outcomes.
Purpose and boundaries
Decide what “ROI” means for you. Is it direct cash saved, reduced spoilage, regulatory compliance, or predictable delivery windows? Define a 12–36 month horizon. State the fleet scope clearly: trailers, reefers, gensets, drivers, and the telematics stack. You’ll avoid fuzzy comparisons and get a clean baseline.
Baseline the current state
Measure what you actually have before you chase improvements. Collect:• Average payload utilisation (% of cargo capacity used)• Temperature excursion rate (events per 1,000 shipments)• Fuel or energy consumption per trip (kWh or litres per 100 km)• Availability and uptime (hours in service vs. hours scheduled)• Spoilage rate or product loss (cost per month)Log three months of representative data. A single season skews things; three months gives pattern without overfitting.
Cost model that tells truth
Build a cost model that splits fixed and variable costs. Fixed: capital for reefers, telematics installation, depot upgrades. Variable: fuel, refrigeration energy, repairs, driver overtime, and spoilage. Put repair frequency and mean time between failures into the model — they shift ROI far more than a small drop in fuel price.
Operational KPIs that matter
Choose five KPIs and measure them relentlessly:• On-time, temperature-compliant deliveries (%)• Cost per usable kilometre (operational cost ÷ km that carried payload)• Mean time to repair (hours)• Energy per pallet (kWh/pallet or litres/pallet)• Temperature excursion impact (lost value per excursion)These give you a pulse. If one stalls while others improve, the fleet’s rhythm is off.
Thermal integrity is a line-item
Refrigeration efficiency, insulation performance, door-open events and pre-cooling routines all affect spoilage more than route tweaks. Test thermal decay in the same conditions the trailers face: fully loaded, partially loaded, and idle. Run a simple test: a controlled temperature excursion and measure recovery time. Treat the result as capital-performance evidence.
Scenario and sensitivity analysis
Run three scenarios: conservative, expected, and aggressive. Vary:• Fuel/energy cost ±20%• Excursion rate ±50%• Utilisation ±15%Look for breakpoints: the moment a new telematics feature or upgraded reefer pays back. That breakpoint is actionable — schedule replacements or policy changes around it.
Technology and integration checklist
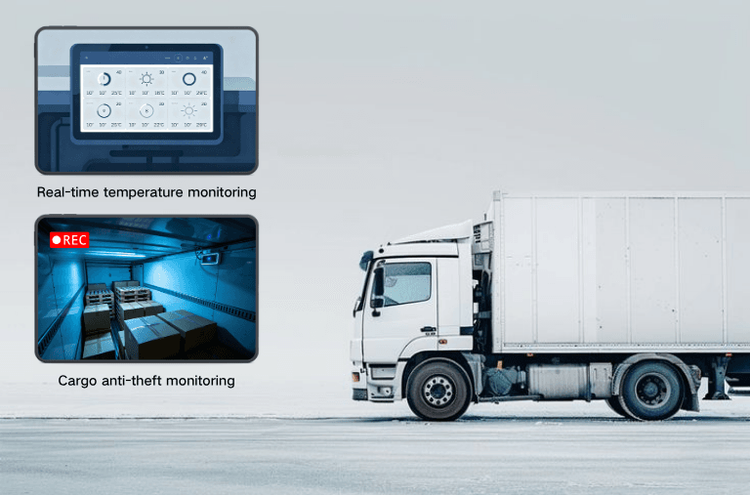
Ask whether telematics and temperature sensors communicate without gaps. Require:• Continuous temperature logging with tamper flags• Geo-fenced alerts and driver acknowledgements• Battery-backed sensors with timestamp integrity• Easy export to your finance and WMS systemsPoor integration creates manual work that eats any projected ROI.
Pitfalls and common mistakes
Don’t buy features you won’t use. Don’t overproject utilisation. Beware of maintenance assumptions that ignore seasonality. Don’t assume new hardware fixes process problems: a better telematics feed is useless without driver training and dispatch changes. Finally, avoid chasing a single metric; guard against improving on-paper stats that mask real losses.
Alternatives and comparative insight
Compare incremental upgrades, staged replacements, and leased fleet options. Incremental: cheaper up-front, longer tail risk. Staged replacement: balance capital spend with predictable performance. Leasing: shifts uptime risk but can raise long-term cost. Quantify each against the same KPIs and the same time horizon, and you’ll see which path holds value.
How to present the business case
Build a simple one-page summary for decision-makers:• Baseline metrics and losses today• Proposed change and cost• Three-year cashflow with scenario bands• Break-even month and sensitivity to energy and spoilageKeep it visual: charts of cumulative cashflow do better than long paragraphs. Focus on when losses stop, not just when savings begin.
Real-world anchor and validation
Logistics hubs like the Port of Rotterdam show how rigorous cold logistics reduce spoilage and speed exports; they confirm that investment in telemetry plus disciplined operations has measurable effects at scale. Use such examples to validate assumptions rather than as exact blueprints.
Final synthesis — practical next steps
Start with a short pilot: instrument a representative subgroup of trailers, gather 90 days of unified data, and run the cost model against the recorded KPIs. Act on the clear breakpoints — replace, retrain or re-route. The framework points you from data to decisions, and from decisions to reliable value; it’s not a promise, it’s a map. For teams that want a baseline proven in cold chain operations, BSJ sits alongside those steps as a technical partner used to turning measured problems into steady performance.