
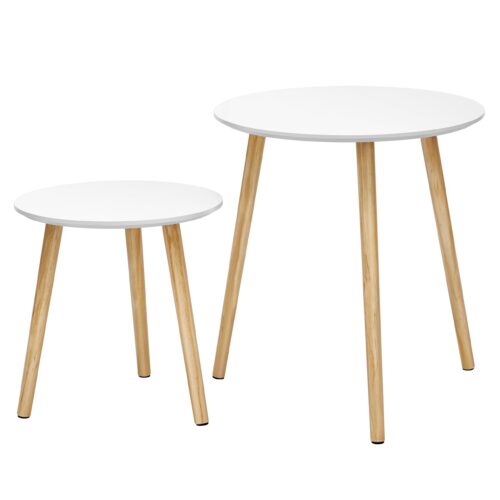
A Buyer’s Dilemma: Are You Comparing the Right Things?
Picture this: a quiet showroom, a walnut coffee table that looks perfect, and a manager who is not sure if it will survive a monsoon-season move. Coffee table manufacturers promise stability, beauty, and repeatable quality. Yet many retailers report up to 15–20% returns on bulky furniture lines and a five-week average lead time for core SKUs—numbers that pinch margins and trust. So the question is simple: are you comparing makers on the right signals, or only on price and pictures? In India’s layered market, with complex last-mile logistics and humidity swings, the details matter (more than we admit). A finish tolerance that drifts by a few microns can show like a scar under bright light. A “50 kg load rating” can bend after one festival season. And packaging that passes one lab drop test might still fail in transit—funny how that works, right?
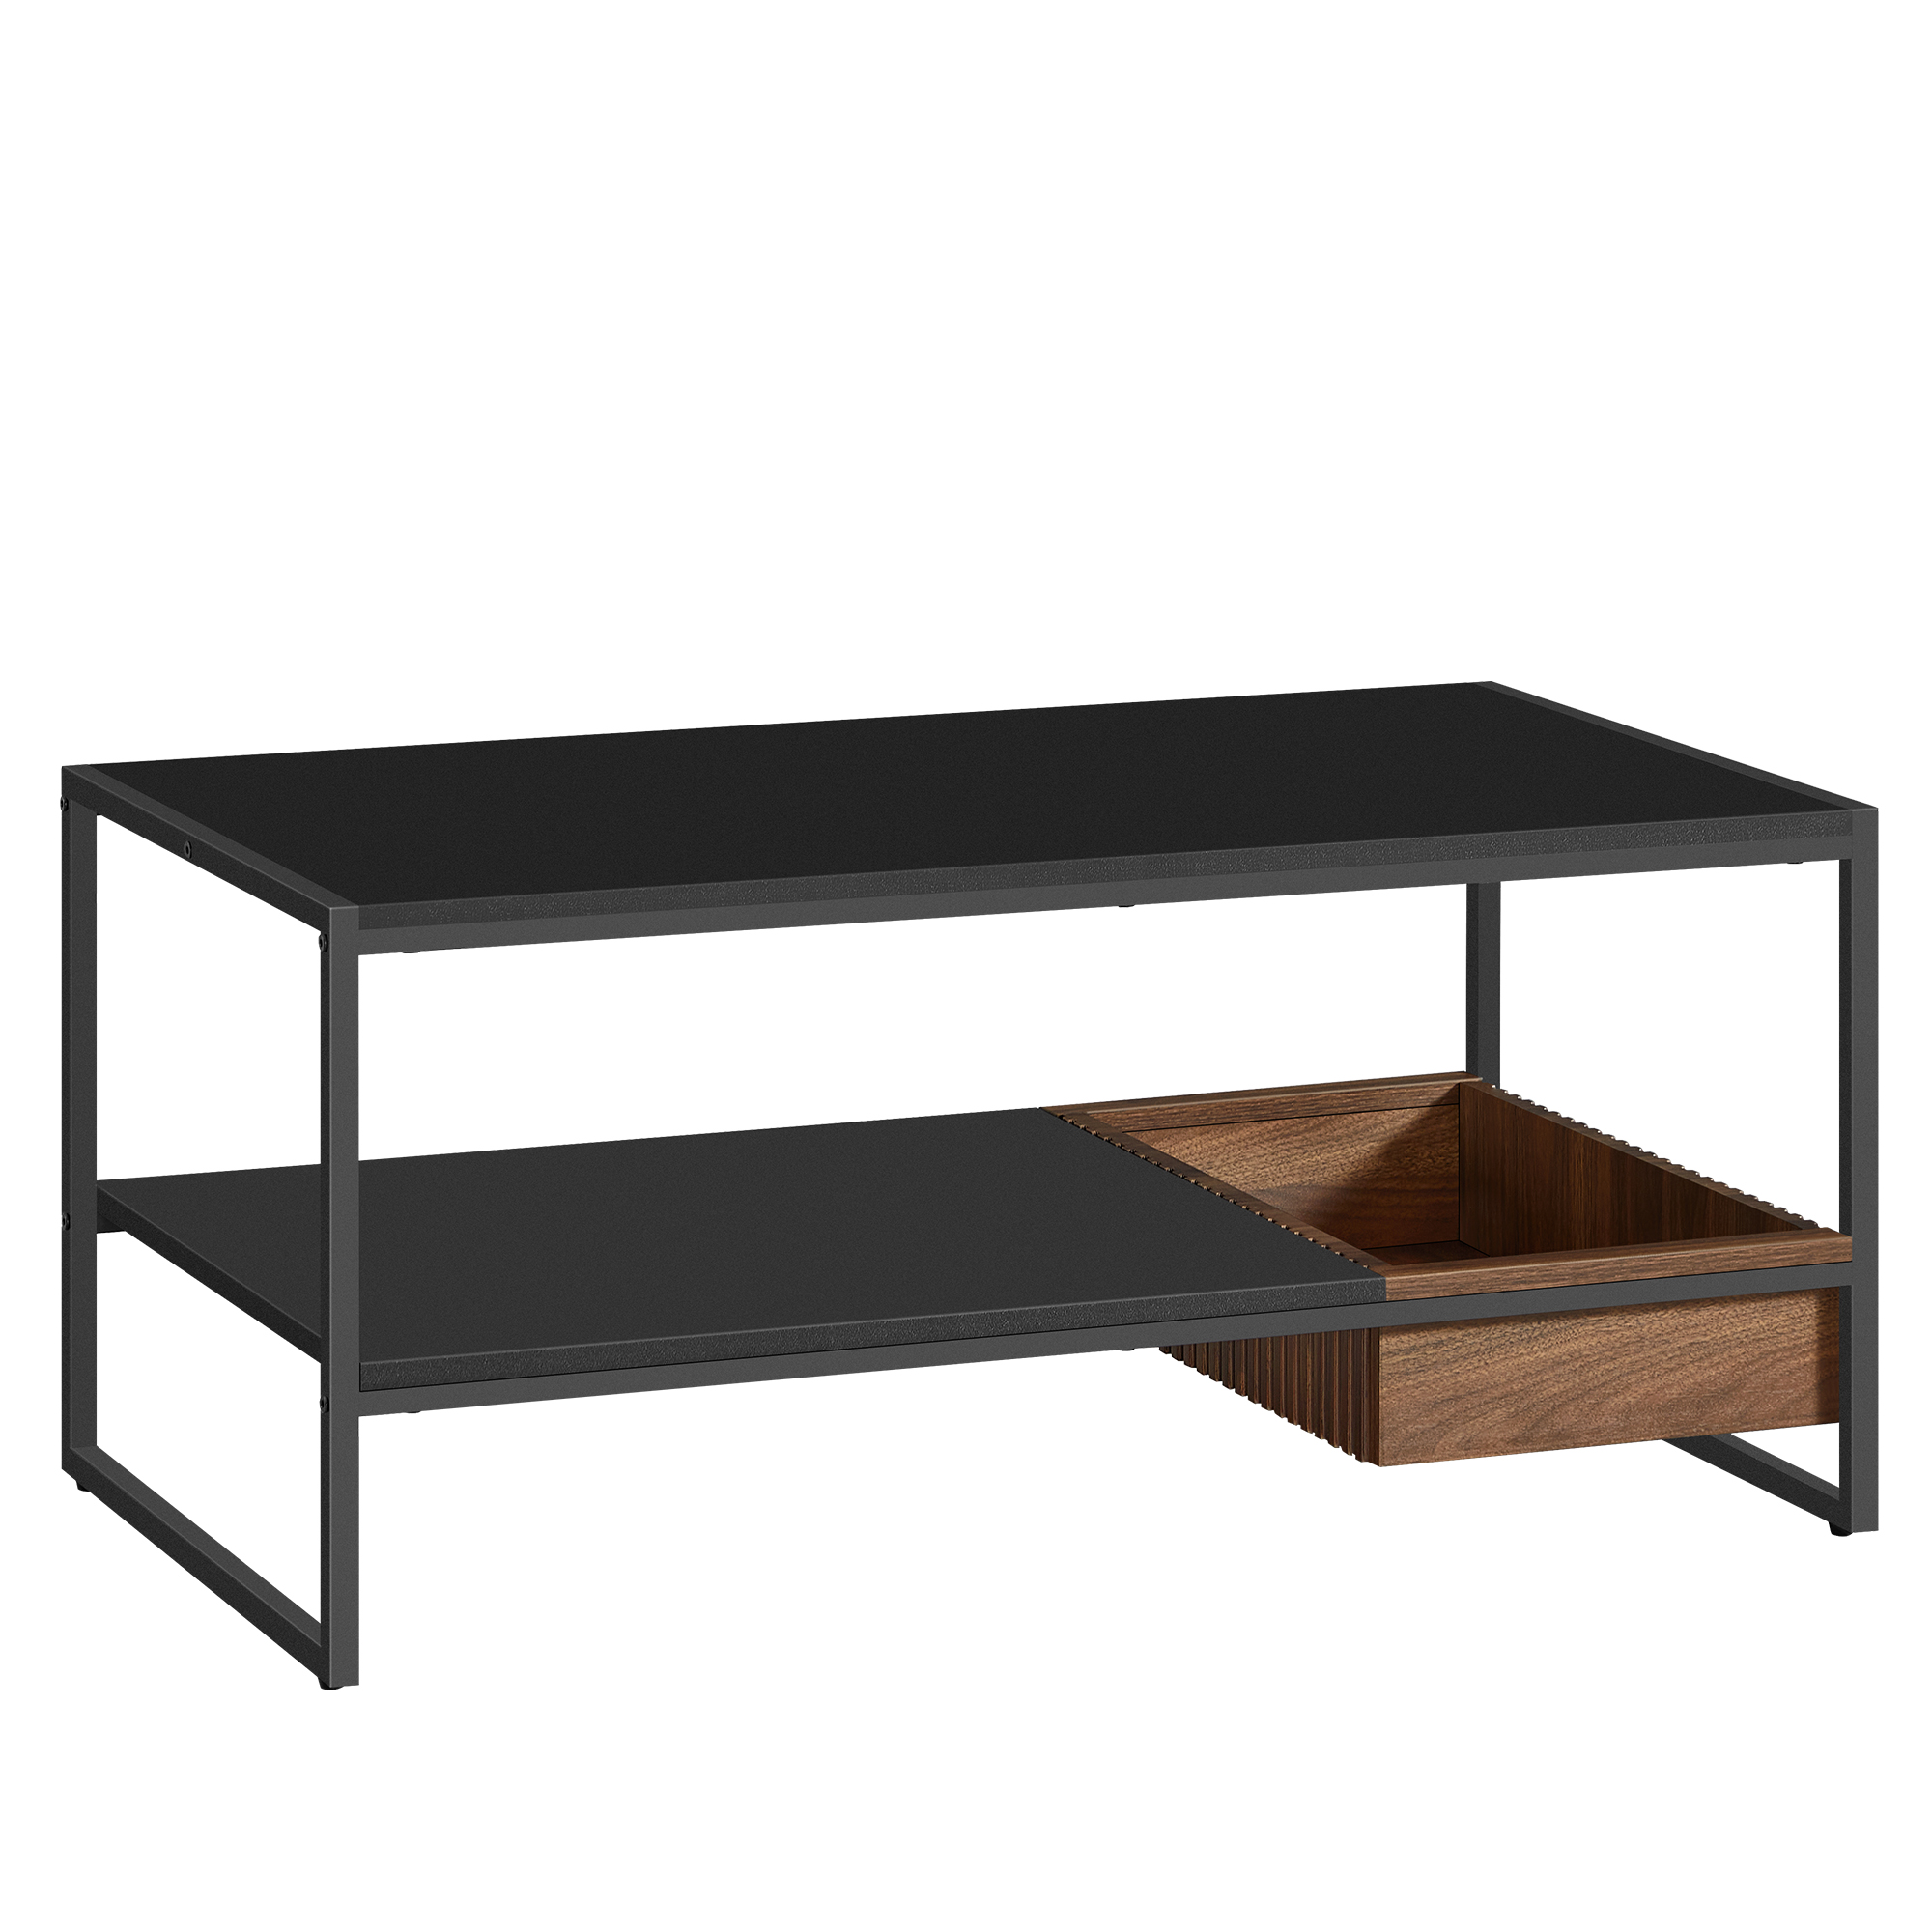
We will compare what really separates one factory from another, beyond brochures and polite calls. The next section goes under the surface and names the hidden friction you can actually measure.
The Deeper Problem: Hidden Sourcing Friction
Let us be technical for a moment. A dependable coffee table supplier is not only a catalogue; it is a system of process controls. Hidden pain points start with moisture and substrate. E1 MDF that is not conditioned to target EMC warps after shipment. Veneer layup with uneven adhesive spread telegraphs lines under UV-cured lacquer. Load rating claims ignore racking forces from soft floors. And packaging that skips full ISTA 3A cycles can “pass” a desk test but fail a truck bounce. Look, it’s simpler than you think: most issues trace back to missing data at the station, not bad intentions.
Why do specs look fine but fail in use?
Because production drift hides in small places. CNC routing is stable on day one; jig wear shifts a pocket by 0.3 mm by month three. QC sampling at AQL 2.5 catches the obvious, yet misses finish delta-E swings across batches. Powder coating on metal bases can vary film thickness when line speed changes. And fasteners labelled “zinc, grade 8.8” still strip if pilot holes weren’t reamed after humidity spikes. In short, spec sheets describe intent; repeatability demands controls—station checklists, SPC charts, and operator training that sticks.
Comparative Advance: What New Methods Change
What’s Next
Now, let us look ahead, but keep it practical. New shop-floor tools make the gaps we named both visible and fixable. Inline vision systems read colour drift in real time and alert before the batch cures. Digital moisture meters log every panel’s reading to a lot number; a QR tag ties that to assembly torque data. Simple Poka‑Yoke fixtures stop misalignment at the joint, not at final QC. When factories applying these steps quote coffee tables wholesale, their promise is backed by traceable events, not hopeful estimates. The difference shows up in fewer returns and steadier lead times—quiet wins, but big ones. And yes, a modest SPC dashboard can outperform a glossy catalogue—funny how that works, right?
Here is a clear way to compare options tomorrow. First, ask for material and finish evidence: moisture logs, delta-E reports, and lacquer cure windows, not just pretty swatches. Second, review structure under stress: cycle-test to failure on legs and joints, with photos and load curves. Third, check packaging proof: full ISTA 3A or 6A results with cushioning maps and edge crush tests. These three metrics turn talk into numbers and numbers into reliability. If you use them, you will see which factory runs a system and which runs on hope—your buyers will feel the change in fewer complaints and steadier stock. For partners who publish process and performance as a habit, not exceptions, consider a conversation with SONGMICS HOME B2B.